After a quiet period of nearly a decade, the UCI’s ‘cycling hour record’ has been making news again over the past year. In February, the time trial powerhouse Fabian Cancellara announced that he would attempt the record in August — an amazing opportunity to see how a cyclist of the modern era stacks up against legends such as Eddie Merckx and Chris Boardman. Athletes were beginning to consider tackling the legendarily brutal challenge which Merckx described as the longest hour of his career.
Given this, it was strange to read in April that Cancellara was already postponing his plans following a rumour that the UCI was considering a change to the rules. Sure enough, in May an official announcement was made. The proposed rule change greatly affects the type of bike and hence the technology which is available to the athlete.
So what are these changes and what does it mean for the legendary hour?
The Hour
The UCI hour record is, in essence, a very simple one. It tests how far a cyclist can ride, around a track, in an hour. Despite this simplicity, the history of the event is spotted with complexity and controversy. Rapid technological advances in the ’80s and ’90s saw astonishing leaps in the distances being covered. During a technological arms race from 1993 to 1996 the record was pushed on by 4,800 m. It had taken 36 years prior to 1993 to achieve the same level of progress.
Worried that the event was becoming more about the bike than its rider, the UCI imposed stringent rule changes, banning the advances in frame design and rider position which occurred during that period. As an illustration of the severity of these changes, the ‘Lotus’ bike from 1992 offers a stark reminder — it appears astonishingly modern despite being over two decades old*.
 The Bike of the future, from 1992
As a response to these changes, Chris Boardman (the holder of the record in 1996 at 56.4 km) made another attempt at the record in 2000, this time using a bike which was of a more ‘traditional’ design with circular tubing, drop handlebars and based on the bike legendary cyclist Eddie Merckx had used in his successful 1972 attempt (49.4 km). This was Boardman’s swansong, locking horns with ‘the cannibal‘ and attempting ‘the hour’ without any recent technological benefits — he beat Merckx’s effort by only 10 metres.
The UCI, clearly enamoured by Boardman’s idea adopted it as the official hour record, creating rules which would require any pretenders to use a bike roughly in-line which Merckx’s of 1972. These new rules** restricted the technology available to the cyclist, they had to use a traditional frame design with circular tubing (no smaller than 2.5 cm in diameter), drop handlebars, spoked wheels, and shallow section rims.
The rampant use of technology had been halted, the hour record was to be preserved in the era of steel tubes and riding caps.
Technology rules
The hour record is of particular interest to the Sports Engineer, I first became aware of its interesting history when giving lectures in schools and to the public. It was a perfect example of the relationship between sport and technology. On one hand it demonstrates the huge performance benefits which can be obtained, on the other, it illustrates how governing bodies react to technology’s threat. In this case the UCI thought that the rapid advances in frame design and rider position were detracting from the purity of the event itself. The record was being broken not necessarily due to a rider’s physical effort but due to the technological expertise they had access to. A level playing field, a concept universally aspired to in sport (especially ball sports), was not in effect — something had to change.
The UCI were making a clear statement by changing the rules and forcing a rider to use a bike similar to the one used by Eddie Merckx in 1972. They drew a line in the sand, the records made after 1972 were ‘technologically doped’. The distances achieved by those riders were down — in some part — to the technology available at the time and no longer valid.
This must have been influenced in some way by the significant status Eddie Merckx has in the cycling pantheon. His legendary status is such that it’s hard for the cycling community to believe anyone can beat him without some kind of nefarious assistance. However, I also think it’s because that after his record in 1972, athletes started to overtly embrace technology; the bikes and the positions of the riders visibly changed. Compare Francesco Moser’s 1984 bike to Merckx’s from 1972.
 Technology in plain sight, compare Merckx’s 1972 bike on the left, with Francesco Moser’s on the right
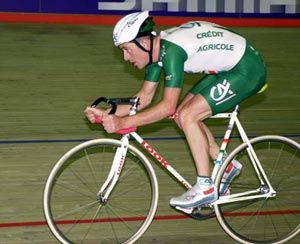
However, wouldn’t Merckx wasn’t also embrace all the technology that he had available? This scanned article from 1991, describes his obsession with weight (ironically, the effect of weight is tiny compared to aerodynamic forces), and the considerable preparations taken to ensure the bike was optimised for the event. Following this argument, it is naive to assume that every athlete who has ever attempted the hour hasn’t taken every step to ensure they bested the distance of their predecessor. Chris Boardman, even with his self-imposed restrictions was able to adopt a number of technological ‘optimisations’ which may have given him an edge — notice the aerodynamic skinsuit in this picture of his attempt. There is ample speculative headroom to consider whether technology was the deciding factor in his attempt considering that he was in the twilight of his career and beat Merckx’s distance by only ten metres .
Recent rule changes
The UCI’s recent rule changes may seem puzzling when fully considered. They are scrapping the arbitrary technological limitations that have governed the record for 14 years. Any bicycle which is legal for any track-based time trial (i.e. the pursuit event) is now permissible in the hour record. This means carbon fibre, streamlined tubing and the stretched ‘time-trial’ riding position (to get an idea of the advantage these kind of technologies permit see our previous article). It also means that all the previously banned records are re-instated, but the current record still stands at 49.7 km (achieved in 2005 by Ondřej Sosenka). For someone unaware of the history of the event it now seems that Boardman beat his own record of 56.4 km in 1996 by riding 49.4 km in 2000.
For years, rules have restricted the technological advantages available to the rider. A relaxation of these rules almost guarantees that the next serious contender will break the current record and take their place in the history books. The level playing field which connected the efforts of riders today with those of Merckx in ’72 has been upset.
How does this work? How are the technological improvements available today any more worthy than those pioneered by Moser, Obree and Boardman in the ’80s and ’90s? I think this move represents an admission by the UCI that technology is intrinsic to progress in sport and without progress athletes and enthusiasts lose interest.
Riders have stayed away from ‘the hour’ because it required training in a completely different way, on completely different equipment and even then the chances of success are slim. By bringing the hour record into the modern era more athletes will be able to justify attempting the record while at the top of their game. Where athletes go, crowds of fans will follow, crucially, the rule change could breathe life into an event stifled by technological prohibition.
It’s great to be able to compare modern performances with those of heroes past but this only works if athletes continue to engage. I don’t think the crowds flocked to velodromes in the ’90s because they were looking to compare a performance with one made more than 20 years ago. I believe the attraction and passion came from a contemporary sense of competition. They went to see if team Obree could beat team Moser or team Boardman; every new victory coming from an extra modicum of effort, an insight or an innovation. Each performance was a combination of athletic prowess and technological innovation.
With rumours that Fabian Cancellara, Tony Martin and Bradley Wiggins may now be considering an attempt at the hour record, we could be returning to a time of great public interest and great competition in this event. I hope the UCI can embrace technology and its positive effect on the sport.
Simon Choppin
P.S. I do have one question though (Devil’s advocate alert), with news that Cancellara was going to attempt the record anyway, why change the rules at all? I’d have loved to have seen how he stack up against Merckx!
*For a more detailed description of the history of the hour record please see Michael Hutchinson’s book ‘the hour‘.
**For the sake of simplicity, I’m ignoring the UCI’s ‘best human effort’ hour record in this article


 Andrew Chapman is a Canadian student who is currently working towards completing an MSc in Sports Engineering at Sheffield Hallam University in the United Kingdom. He previously completed a BSc in Kinesiology at Laurentian University in Canada. He is an avid sports enthusiast who has an interest in sports technology and innovation. Andrew puts high importance towards continued education and research, with the mindset that there is always more to learn and something that can be improved. He has a background in baseball and tennis research, in which he focused on performance improvements and injury reduction. He enjoys playing all sports and is always eager to join in on a game with friends and/or volunteer his time towards helping others on and off the sports field.


